
This blog post is provided by M. C. Dzul, W.L. Kendall, C.B. Yackulic, D.R. Van Haverbeke, P. Mackinnon, K. Young, M.J. Pillow & J. Thomas and tells the #StoryBehindThePaper for the paper „Estimating migration timing and abundance in partial migratory systems by integrating continuous antenna detections with physical captures”, which was recently published in the Journal of Animal Ecology. In their paper the authors describe a multistate mark-recapture modeling approach to estimate abundance of residents and migrants and apply it to estimate migration timing and abundance of three fishes in Grand Canyon, Arizona.
Migration is a widespread phenomenon among many different animals. In many migratory species, migration is “partial”- indicating that only a proportion of animals migrate, so that the population is comprised of both migratory and non-migratory individuals (hereafter migrants and residents, respectively). These two life history types (migrant & resident) often exhibit differences in growth, survival, and reproduction. For example, migrants may overwinter in one habitat to optimize growth then move into a different habitat during the breeding season to optimize reproduction, whereas residents may have poorer growth and reproduction but higher survival (due to not incurring the cost of migration). Monitoring abundances of migrant and resident animals can indicate if one life history strategy is in decline and provide guidance to species conservation efforts. Many studies of partial migration suggest that migratory individuals may be disadvantaged by anthropogenic change (e.g., habitat destruction, climate change). In addition, studies can also evaluate the timing of migration (i.e., phenology) to look for shifts in migration timing due to climate change.
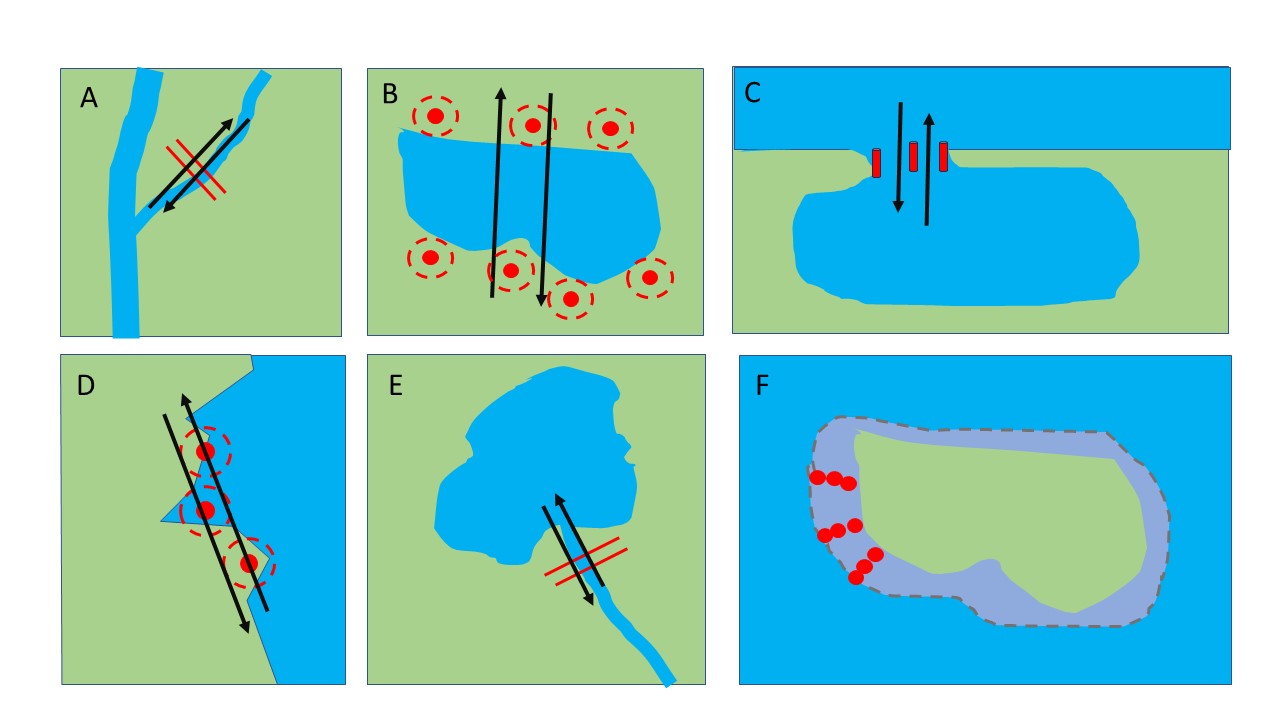
While migration is recognized to be important for numerous species, quantifying migration and partial migration can be difficult, particularly when migration occurs over a long period and arrival and departure times are staggered so that the timing of arrivals and departures overlaps. Automated telemetry technologies (e.g., automated radio telemetry systems) can be placed along a migratory corridor to detect tagged individuals as they migrate between two habitats. For example, Motus Wildlife Tracking System is an international collaborative research network of automated radio telemetry receiving stations often used to detect birds and other animals along their migration route. For fishes, arrays of passive integrated transponder (PIT) antennas can be placed in a river near the outlet of a large lake (i.e., in the river mouth) to detect spawning movements of fishes migrating between tributaries and lakes. In addition, acoustic receivers are often used to detect marine fishes moving between estuaries and rivers. While automated telemetry technologies provide continuous detections over long intervals and can have high detection probabilities, these technologies can only detect tagged individuals (i.e., unmarked individuals are not detectable) and this limits the ability to use these data for abundance estimation. Additionally, because residents do move through the migratory corridor, these individuals are not detectable by automated telemetry systems. For these reasons, adding physical captures to antenna detections is necessary to enable quantification of partial migration.
Our study describes a multistate mark-recapture modeling approach that pairs physical captures and automated telemetry detections to estimate abundance of residents and migrants, as well as to evaluate migration timing. Multistate models are commonly used to estimate demographic parameters (e.g., survival, abundance, growth) when detection probabilities or demographic parameters differ among states. For example, fish located in the lake may have different capture probabilities than fish in the river, so that a multistate model would have states associated with site (i.e., lake or river) to help account for these differences in detection, while also allowing fish to move between the lake and river (i.e., allowing for state transitions). Because automated telemetry systems placed along a migratory corridor detect individuals that are in the act of migrating between habitats, our approach is an adaptation of a multistate model that allows for animals transitioning between states to be detectable. Using the example earlier, fish that are in the lake or in the river are not detectable by the automated telemetry system, but only fish that are actively moving from the lake to the river (or vice versa). We pair detections from automated telemetry systems with physical captures to provide information about untagged and resident animals. As part of this work, we created a data processing tool for the statistical program R (R package: ArrayAbundance) that can help biologists explore and model data from remote detection systems.
We apply our model to estimate migration timing and abundance of three fishes (humpback chub Gila cypha, flannelmouth sucker Catostomus latipinnis, and bluehead sucker Catostomus discobolus) in Grand Canyon, Arizona. These fishes were able to persist in the Colorado River in Grand Canyon despite the substantial environmental changes (e.g., reduced water temperature, reduced flooding) that occurred in this river ecosystem after construction of Glen Canyon Dam (finished in 1966). All three of these species migrate between the Colorado River and a warmwater tributaries, such as the Little Colorado River (LCR), to spawn. Our model uses detections of fishes from a PIT tag double-array system located in the LCR (~1.7 river kilometers upstream the Colorado River confluence) and physical captures from two sampling events in the LCR to estimate abundance of migrants and residents.

We found that, for all three species, abundance of migrants in LCR during the spring was much higher than residents. We also found differences in migration timing among species, where flannelmouth sucker arrived and departed earlier than humpback chub and bluehead sucker, which had more similar movement timing. Body size influenced movement timing and life history strategy in humpback chub, where larger individuals were more likely to be migrant and more likely to arrive earlier compared to smaller individuals. Additionally, while many fish studies posit that floods are an important movement cue for spawning migrations in rivers, all three fishes moved into the LCR in 2021 (a year without winter/spring floods) and abundances of migrants were roughly similar across years (2021 and 2022), indicating that floods are not necessary to initiate migration into the LCR for these species.


Our work highlights the importance of tributaries in large river networks and shows that body size can influence migration timing and life history strategy. More generally, we hope that our approach can be used for other studies of partial migration to help differentiate residents and migrants, or phenological migration studies that use automated telemetry systems to detect migrating individuals.
Read the full paper
Dzul, M. C., Kendall, W. L., Yackulic, C. B., Van Haverbeke, D. R., Mackinnon, P., Young, K., Pillow, M. J., & Thomas, J. (2024). Estimating migration timing and abundance in partial migratory systems by integrating continuous antenna detections with physical captures. Journal of Animal Ecology, 00, 1–16. https://doi.org/10.1111/1365-2656.14076
