
Understanding animal occupancy should be relatively simple – but actually requires some complex thinking. In this blog post, Jonathon J. Valente (Postdoctoral Fellow, Smithsonian Conservation Biology Institute, Migratory Bird Center) and Quresh S. Latif (Biometrician, Bird Conservancy of the Rockies) delve into the surprisingly tricky question of ‘how many sites are occupied?‘
Occupancy has long been a focus in ecology. Estimating probability of site occupancy (or proportion of sites occupied) is one way to quantify a species’ distribution that requires less effort to measure than other population attributes (e.g., abundance, survival, and reproduction). Further, when measured appropriately, occupancy estimates can be informative of the abundance and dynamics of a population (Joseph et al. 2006, Noon et al. 2012, Clare et al. 2015). Conceptually, answering the question ‘How many sites are occupied?’ seems straightforward – count sites with ≥ 1 individuals. In practice, however, estimating occupancy accurately requires careful forethought.
Historically, researchers simply recorded detection frequency to quantify occupancy trends or patterns. Yet for species that are imperfectly detected (i.e., that may be present but unobserved), detection frequency underestimates occupancy, and detectability must be measured or accounted for separately. MacKenzie et al. (2002) and Tyre et al. (2003) proposed an elegant solution to the problem of imperfect detection: survey sites repeatedly over a period in which occupancy can be assumed not to change (i.e., the closure assumption), and use the resulting data to inform a hierarchical model that estimates occupancy while correcting for imperfect detection. This approach was revolutionary and led to an explosion in development, application, and extension of occupancy models for various systems, data structures, and questions (Bailey et al. 2014).
Since development of occupancy models, ecologists have followed protocol, conducting repeat surveys and swallowing the sometimes bitter (but necessary) pill representing the closure assumption. The basic occupancy model (MacKenzie et al. 2002, Tyre et al. 2003) leverages repeat surveys to estimate two fundamental parameters, ψ and p. Given closure, these parameters respectively represent occupancy and detectability, ostensibly separating the biological parameter of interest from the noise arising from the observation process. Yet despite early recognition of the importance of sampling structure (e.g., MacKenzie et al. 2002, Tyre et al. 2003, MacKenzie and Royle 2005), we fear many researchers fail to appreciate how interpretation of ψ and p change as a function of how data are collected.
Multiple biological processes can influence ψ and p, and it is critical to consider how these interact with the timing of surveys and the size and spacing of surveyed sites (i.e., sampling scales). For example, if sites are large enough to be occupied by multiple individuals, variation in local abundance may affect detectability (more animals are easier to detect; Royle and Nichols 2003). Thus, detectability, rather than occupancy, may in fact reflect some potentially informative biological pattern.
Another example of how sampling scale can influence interpretation of model parameters is illustrated in Figure 1. Looking at this figure, one might ask, “What proportion of these sampling units are occupied?”
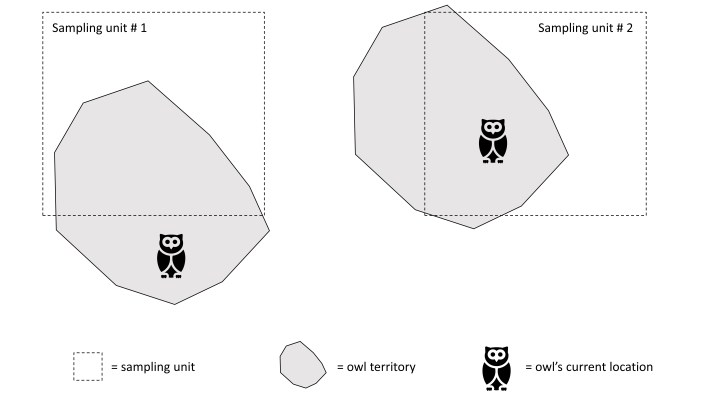
In this scenario, a mobile species utilizes fixed territories comparable in size to the sampling units. As a result, a single territory is rarely completely contained within a sampling unit, and an individual may move in or out of the sampling space (i.e., temporary emigration) during its daily routine. Looking at the figure, some may argue that only one of these sites is occupied, because only one has an owl physically present within it. Others may say that both are, because both intersect the territory of at least one owl. Neither answer is wrong, per se, but the structure of sampling determines which perspective is reflected in the occupancy model estimates. If surveys are timed to eliminate the potential for within-territory movement between repeat surveys, ψ = 0.5, reflecting the proportion of sites with an owl physically present during a snapshot in time. If surveys are repeated over broader temporal scales allowing movement between samples, ψ = 1.0, reflecting the proportion of sites intersecting a breeding territory.

This exercise highlights an important misconception among many practitioners of occupancy models – that occupancy is a population parameter of inherent value regardless of how it is measured. In reality, interpretation of occupancy is inextricably linked to sampling (Lele et al. 2013, Steenweg et al. 2018), so researchers cannot assume that repeated samples of any sort will produce estimates of ψ and p appropriate for their question. Indeed, the processes highlighted above are just a few examples of biological factors that can influence occupancy model parameters. Others include (but are not limited to), births, deaths, colonization, dispersal, local population density, and behaviors that affect detectability (e.g., rates of singing and territorial display; see Warren et al. 2013). Each process operates at different spatial and temporal scales, and numerous recent studies elucidate how they interact with sampling to shape estimation and interpretation of occupancy (e.g., Efford and Dawson 2012, Valente et al. 2017, Latif et al. 2018, Steenweg et al. 2018).

In a provocative critique, Hayes and Monfils (2015) suggest scrapping application of occupancy models to avian point count data altogether on the grounds that movement between repeat surveys clouds interpretation of ψ. Latif et al. (2016) point out, however, that Hayes and Monfils (2015) were interested in the proportion of sites with ≥ 1 individual physically present during a ‘snapshot’ in time (i.e., instantaneous occupancy), yet they designed their sampling to estimate the proportion of sites intersecting ≥ breeding territory (i.e., asymptotic occupancy; sensu Efford and Dawson 2012). As noted above, estimating instantaneous occupancy requires replicate samples over fine time scales that disallow within-territory movement between surveys (e.g., Rota et al; 2009, Betts et al. 2008, McClure & Hill 2012). Instantaneous occupancy is particularly relevant where biologists monitor occupancy in place of abundance, and in these situations may also be more cost effective to measure (Latif et al. 2018). For researchers interested in metapopulation or range dynamics, however, repeat surveys may be better distributed over broader timeframes or spatial scales so that detectability accounts for within-territory movement and local abundance, making occupancy more clearly interpretable as an estimate of species distribution (Steenweg et al. 2016, Valente et al. 2017). Thus, we need to carefully consider sampling scale to informatively estimate occupancy.
So, how many sites in Figure 1 are occupied? If you’re interested in tracking population change, the best answer may be ‘one’ (e.g., Latif et al. 2018; Steenweg et al. 2018), but if you’re interested in quantifying metapopulation or range dynamics, the best answer may be ‘two’ (e.g., Valente et al. 2017). Regardless, researchers need to critically consider how biological processes interact with sampling to design surveys and ultimately to estimate occupancy appropriately for their question.
Acknowledgements
We thank Bird Conservancy of the Rockies for partially funding the time required to write this piece.
Literature Cited
Bailey, L. L., MacKenzie, D. I., & Nichols, J. D. (2014) Advances and applications of occupancy models. Methods in Ecology and Evolution, 5, 1269-1279.
Betts, M. G., Rodenhouse, N. L., Sillett, T. S., Doran, P. J., & Holmes, R. T. (2008) Dynamic occupancy models reveal within-breeding season movement up a habitat quality gradient by a migratory songbird. Ecography, 31, 592-600.
Clare, J. D. J., Anderson, E. M., & McFarland, D. M. (2015) Predicting bobcat abundance at a landscape scale and evaluating occupancy as a density index in central Wisconsin. The Journal of Wildlife Management, 79, 469-480.
Efford, M. G., & Dawson, D. K. (2012) Occupancy in continuous habitat. Ecosphere, 3, 32.
Hayes, D. B., & Monfils, M. J. (2015) Occupancy modeling of bird point counts: implications of mobile animals. The Journal of Wildlife Management, 79, 1361-1368.
Joseph, L. N., Field, S. A., Wilcox, C., & Possingham, H. P. (2006) Presence-absence versus abundance data for monitoring threatened species. Conservation Biology, 20, 1679-1687.
Latif, Q. S., Ellis, M. M., & Amundson, C. L. (2016) A broader definition of occupancy: comment on Hayes and Monfils. The Journal of Wildlife Management, 80, 192-194.
Latif, Q. S., Ellis, M. M., Saab, V. A., & Mellen-McLean, K (2018) Simulations inform design of regional occupancy-based monitoring for a sparsely distributed, territorial species. Ecology and Evolution, 8, 1171-1185.
Lele, S. R., Merrill, E. H., Keim, J., & Boyce, M. S. (2013) Selection, use, choice and occupancy: clarifying concepts in resource selection studies. Journal of Animal Ecology, 82, 1183-1191.
MacKenzie, D. I., Nichols, J. D., Lachman, G. B., Droege, S., Royle, J. A., & Langtimm, C. A. (2002) Estimating site occupancy rates when detection probabilities are less than one. Ecology, 83, 2248-2255.
MacKenzie, D. I., & Royle, J. A. (2005) Designing occupancy studies: general advice and allocating survey effort. Journal of Applied Ecology, 42, 1105-1114.
McClure, C. J. W., & Hill G. E. (2012) Dynamic versus static occupancy: how stable are habitat associations through a breeding season? Ecosphere, 3, 60.
Noon, B. R., Bailey, L. A., Sisk, T. D., & McKelvey, K. S. (2012) Efficient species-level monitoring at the landscape scale. Conservation Biology, 26, 432-441.
Rota, C. T., Fletcher R. J., Dorazio, R. M., & Betts, M. G. (2009) Occupancy estimation and the closure assumption. Journal of Applied Ecology, 46, 1173-1181.
Royle, J. A., & Nichols, J. D. (2003) Estimating abundance from repeated presence-absence data or point counts. Ecology, 84, 777-790.
Steenweg, R., Hebblewhite, M., Whittington, J., Lukacs, P., & McKelvey, K. (2018) Sampling scales define occupancy and underlying occupancy-abundance relationships in animals. Ecology, 99, 172-183.
Tyre, A. J., Tenhumberg, B., Field, S. A., Niejalke, D., Parris, K., & Possingham, H. P. (2003) Improving precision and reducing bias in biological surveys: estimating false-negative error rates. Ecological Applications, 13, 1790-1801.
Valente, J. J., Hutchinson, R. A., & Betts, M. G. (2017) Distinguishing distribution dynamics from temporary emigration using dynamic occupancy models. Methods in Ecology and Evolution, 8, 1707-1716.
Warren, C. C., Veech, J. A., Weckerly, F. W., O’Donnell, L., & Ott, J. R. (2013) Detection heterogeneity and abundance estimation in populations of Golden-cheeked Warblers (Setophaga chrysoparia). The Auk, 130, 677-688.
