
This blog post is provided by Emily Simmonds from the Norwegian University of Science and Technology (NTNU) and tells the #StoryBehindThePaper for her article Cue identification in phenology: A case study of the predictive performance of current statistical tools which has been shortlisted for the 2019 Elton Prize.
How do individuals decide when to start breeding, come out of hibernation, drop their leaves, or migrate? This is a challenging question. All of these life-history events are energetically demanding and timing poorly can have negative impacts on reproductive success (as we found in our Ecology and Evolution paper from 2017). Therefore, timing them correctly is vital. Conditions change year to year, so matching the period of highest resources is a complicated process. Many species must use cues from their environment to determine when the optimal conditions will occur and control when they begin particular events. In a period of rapid climatic change, we are seeing more and more shifts in the timing of seasonal events (phenology). Therefore, understanding how species use their environments to decide on timing, is a key part of understanding future biological responses to climate change. I began thinking about these questions in the context of breeding phenology during my PhD at the University of Oxford. At this point, I was working on a long-term study population of great tits in Wytham Woods. This study system has produced an exemplary multidecadal dataset, which has been used to look at questions regarding phenology and environmental change, currently headed by Ben Sheldon and Ella Cole. My PhD work sought to explain the causes and the consequences of the changes in breeding timing of this species and how well they match with their prey species (the winter moth caterpillars). It is a particular challenge for the great tits as they need to begin laying eggs approximately 30 days before the peak of caterpillar abundance.

One of my primary questions was ‘what environmental cues do great tits use to work out when they should begin breeding?’. When I first started searching for an answer to this question, I noticed that the most common way humans try to work this out is by using statistical analyses. We take data on weather conditions and phenology, and then use various statistical approaches to decide which weather variable, over which time period, is most important for explaining year to year fluctuations in phenology. The second thing I noticed was a wide variety of these different statistical approaches were available. Each was based on different statistical assumptions and had different biological interpretations, some perhaps more realistic than others. At this point, I found myself becoming less interested in exactly how the great tits use environmental cues and more interested in ‘how do scientists work out which environmental cues species are using?’ and ‘how good are we at it?’
This is where my recently published paper in the Journal of Animal Ecology began. Here, I tested several aspects of five commonly applied cue identification methods. We aimed to look at whether the cues identified are similar across methods and in time and how the explanatory power of the five cues varied. During my postdoc at the Norwegian University of Science and Technology, I expanded this with a more thorough assessment of the predictive ability of the different methods. I was particularly keen to explore this predictive context due to the increasing focus on predictive analyses in ecology, but the lack of accompanying testing of those predictions.
We used one mechanistic model based on the sum of the number of degrees above a minimum daily temperature and four regression-based models, two of which use smoothing methods to allow every day of the year to influence phenology (climate sensitivity profiles and penalized signal regression), and two which use temperature over a window of days that is either fixed to particular calendar days each year (absolute sliding window method) or relative to the phenology itself (relative sliding window method).
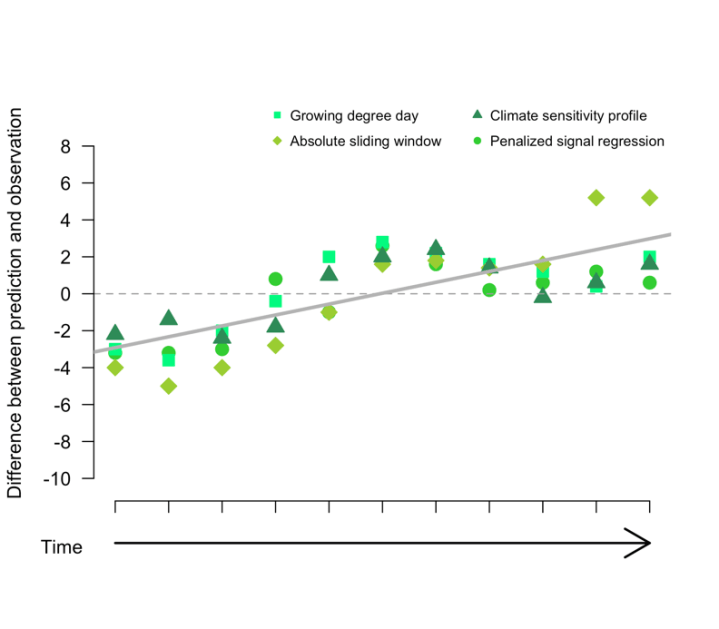
Our first finding was that the period of the year identified as most important for phenology was consistent across four of the five methods we tested. This was promising as it suggested that despite statistical differences, the methods were picking up on a similar process. However, it also highlighted the risks of using relative cue identification techniques. The second finding focused on predictive ability. We found that the accuracy and precision of predictions differed by method with a penalized signal regression resulting in the most accurate and most precise predictions in our case, but almost indistinguishable from an absolute sliding window method. Accuracy was highest for near‐future predictions, which was not very surprising but still useful to see. This observation also led to our final finding, which was an effect of time on both the cue identified and predictive ability. The number of days identified as important and their position in the calendar year shifted across time. This was mirrored in predictive accuracy that also showed a relationship with time. Predicted phenology was initially earlier than observations but ended up lagging behind. This trend in time suggests that our current statistical tools are either failing to capture a key component of the cue–phenology relationship or the relationship itself is changing, something that typically assumed to be static in phenological analyses.
Our findings from this work should make us reassess the assumptions we have imposed in the field of phenology, particularly that many elements of the process of deciding when to breed are fixed. It seems from our results that there is more flexibility or movement of these processes than we have considered to date. It also highlights a need for a better understanding of what our statistical methods actually capture and whether this would match the biological process we are aiming for. I hope this paper will provide some guidelines and general food for thought for those working in phenology.
