
This blog post is provided by Johannes Krietsch after winning the nerdy” category category of MoveMapCompetition from the BES Movement Ecology SIG. Congratulations Johannes!
A key aspect in the study of animal movement is to understand the interaction between the moving subject and the medium in which it moves. In the case of flying birds, the medium is the atmosphere. Flying can be energetically costly and an efficient technique can be critical to an individual´s survival, especially in the case of long-distance travellers. The atmosphere is also dynamic, with variable winds and air currents, which adds another layer of complexity to understanding how individuals move. When mapping the trajectory of a bird, we illustrate the combined result of its movement and that of the wind (i.e. speed and direction). Just think about going by bike on a windy day and how it feels to go with or against the wind. While in flapping flight, a bird may even move backwards under extreme head winds. Thus, taking wind into account is crucial when studying navigation and migration strategies in birds.
Visualization of 85 male pectoral sandpiper flights with the actual wind conditions and with wind support indicated (tailwinds in green and headwinds in red). All individuals departed over the sea ice close to Utqiaġvik, Alaska. (Source: Krietsch et al., 2020 Proc. R. Soc. B.)
With this idea in mind, we decided to analyse a recently discovered form of nomadic movement of male pectoral sandpipers through the Arctic. The aim was to understand how wind influences the breeding site sampling of this polygynous shorebird and if individuals opportunistically decide where to go based on the wind. An important part in understanding this was the visualization I made (see above) which shows the movements of individuals within the wind. This visualization recently won the MoveMap competition from the British Ecological Society Movement Ecology Special Interest Group in the “nerdy” category. To read more about the biological background and technical background (how to do such a visualization in R) see below. Read the full story in our associated article.
The biological background
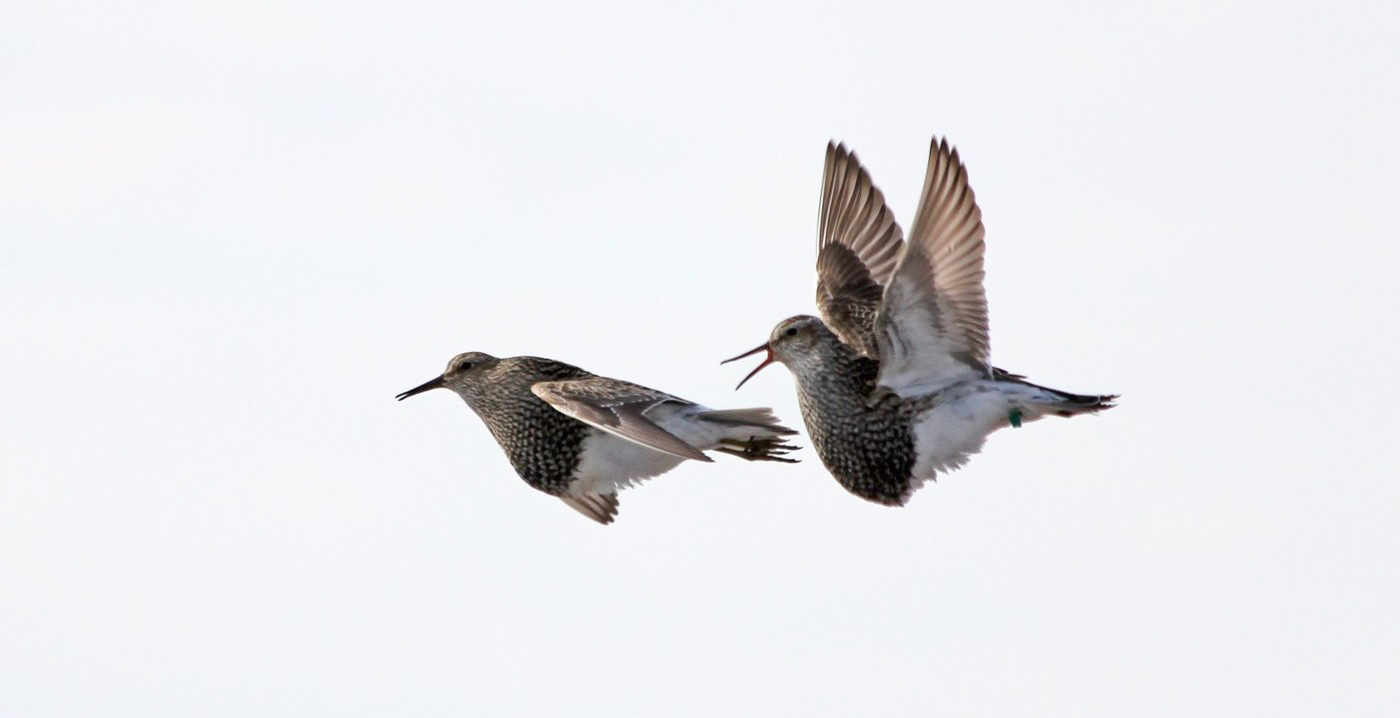
Male pectoral sandpipers (Calidris melanotos) are truly fascinating creatures. Unfortunately, few people have the chance to see their most peculiar side, which they express once in the Arctic. Most pectoral sandpipers winter in the pampas of Argentina where they strike you as a shy and rather cryptic shorebirds. Their transformation begins after spring migration, when their testosterone levels go through the roof. At that point they only focus on kicking intruders out of their territory and on impressing females. Pectoral sandpiper males put up quite a show to do so, with distinct aerial displays where they blow up their throat sack and hoot (see picture and hear hooting call).
The show does not end at the first convenient location, though. As for any popular rock star, pectoral sandpiper males tour through multiple sites, most of the times after performing for just a few days. Due to the extreme competition, some males of this species endeavour to visit up to 24 different sites and cover almost the whole breeding range all within the short month of Arctic summer. This was recently discovered thanks to the use of satellite tags and the results have been published by my supervisors Bart Kempenaers and Mihai Valcu.
Full extent of the breeding site sampling movements of 120 male pectoral sandpipers (2012 in red and 2014 in blue). (Source: Kempenaers and Valcu, 2017 Nature).
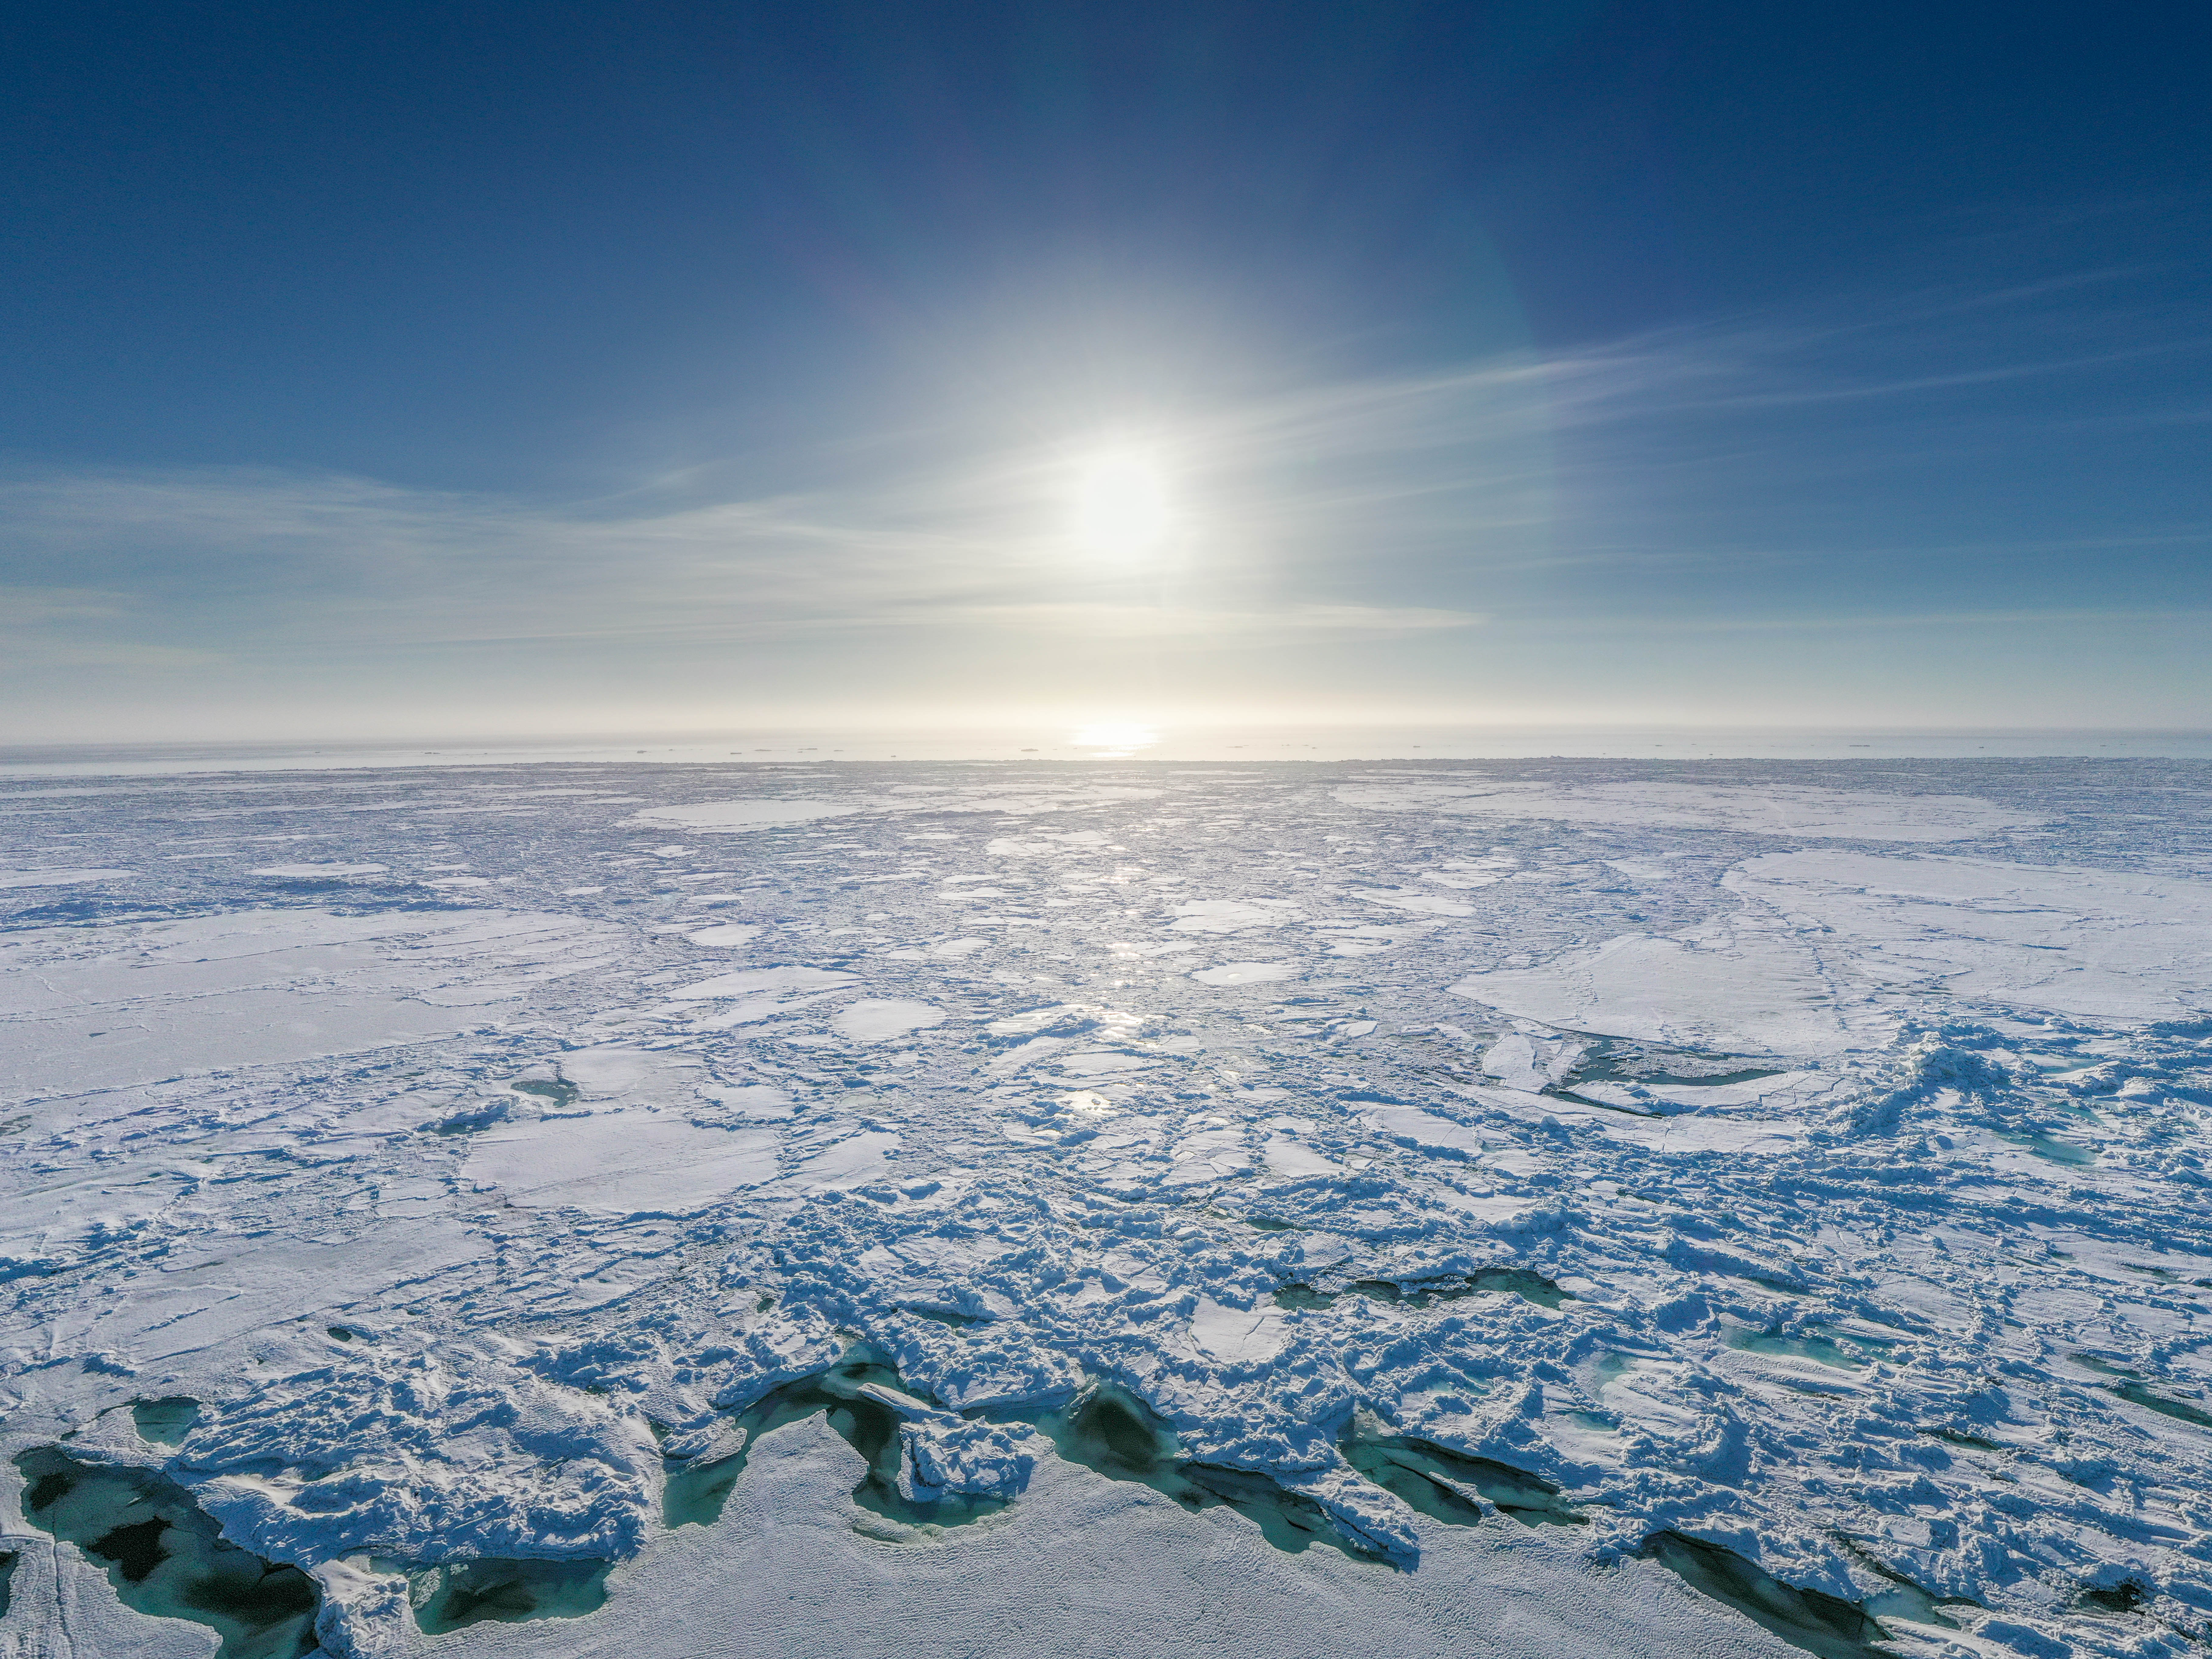
This nomadic behaviour comes to a great risk for pectoral sandpipers. The environmental conditions of the new site are unpredictable and the flights occur over an inhospitable frozen ocean. The area is characterized by strong winds, which for these birds can either be a winning ticket or be the cause of a failed breeding season. When the wind blows out from Utqiaġvik, Alaska, you can be lucky and effortlessly end up in Russia, or be drifted towards the North Pole, where a U-turn is the only good decision to make. By comparing the tracks with wind data, our analysis confirmed that individual males choose their next site opportunistically based on the prevailing wind conditions. Moreover, possibly because of the different distance from the wintering grounds, individuals did not fly westwards into the Russian Arctic without wind support, but occasionally flew eastwards into the North American Arctic against strong headwinds (see details here).
The technical background
How to visualize the flight trajectories together with the wind? We knew about the impressive visualization by Cameron Beccario (earth) and thought it would be fantastic to add the tracks to that particle flow. Since “earth” is written in JavaScript, I started from scratch in R. The first thing I needed were the wind data, that I downloaded from global reanalysis model (ERA-Interim). The data were available as raster layers with u- and v-wind component in 6-hour intervals and ~80 km resolution, that I resampled with a bicubic interpolation to 10 km. The foundation was laid.
To get particles moving, the trick was to spread them randomly on the map, extract the closest (in space) wind data for each particle, and use these to calculate their next position given the wind speed and direction experienced for a certain time period (15 min in this case). Repeating this procedure results in particle tracks over one raster layer that once animated create a dynamic visualization of the wind similar to “earth”. However, wind conditions change through space and time, as our bird tracks do. To include the time component we extracted the closest (in space and time) wind data, which allowed particles to move through space and time. Lastly, I overlaid the trajectories of the male pectoral sandpiper movements, and visualized the amount of wind support at any given time and space with a colour ramp, where red indicates movement against and green movement with the wind. This helped us understand the movements and showed us previously undetected details. For example one male left initially towards Russia, but then did a U-turn because he (most likely) realized that he was facing a storm front (see at 01:12: https://www.youtube.com/watch?v=A-Q5J1wRBUA&t=1m12s).
I put all used R functions to do such a visualization of wind particles with bird tracks and a description of the workflow with a small example in the R package “windR”, which can be found on GitHub.
About the author
Johannes Krietsch is a PhD student at the Max Planck Institute for Ornithology (Department of Behavioural Ecology and Evolutionary Genetics) and connect movement data and behavioural observations to understand the evolution of mating strategies of pectoral sandpipers and red phalaropes.
Associated paper
Krietsch J., M. Valcu and B. Kempenaers, 2020: Wind conditions influence breeding season movements in a nomadic polygynous shorebird, Proc. R. Soc. B.28720192789

One thought on “Blown away: How male pectoral sandpipers look for their next partner”